The BCG Matrix, also known as the Boston Consulting Group Matrix, is a strategic tool used by businesses to evaluate their product lines and determine where to allocate resources.

The BCG Matrix was first outlined by Alan Zakon and then developed by Bruce D. Henderson in 1968 while he was working at the Boston Consulting Group (BCG), a management consulting firm. The matrix was created to help businesses evaluate and prioritize their product lines.
Henderson believed that businesses needed a tool to identify which products should receive investment and which ones should be phased out. He developed the BCG Matrix as a way to categorize a company’s products based on their market share and growth rate.
The BCG Matrix quickly became a popular strategy tool for businesses, and it is still widely used today. It has been used by companies such as General Electric, IBM, and Coca-Cola to evaluate their product portfolios.
Over the years, the BCG Matrix has undergone some modifications and adaptations to reflect changes in the business environment. The matrix has been updated to include additional factors such as industry attractiveness and competitive strength to provide a more comprehensive view of a company’s product portfolio.
Boston Growth Matrix (BCG Matrix)
How does the BCG Matrix work?
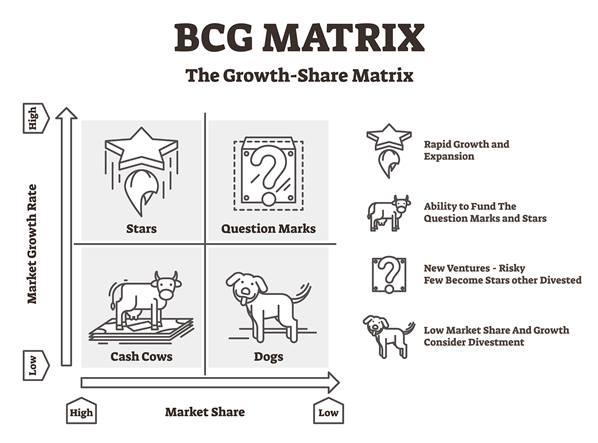
The matrix categorizes a company’s products into four categories or quadrants: Stars, Cash Cows, Question Marks, and Dogs, based on their market share and growth rate.
 Stars
Stars
Stars are products with a high market share and high growth rate. These products have the potential to become cash cows if the company invests in them. Companies should allocate resources to maintain or increase their market share.

Cash Cows
Cash cows are products with a high market share but low growth rate. These products generate a lot of revenue for the company but do not require significant investment. Companies should use the revenue from these products to invest in stars and question marks.

Question Marks
Question marks are products with a low market share but high growth rate. These products require investment to increase their market share and become stars. Companies should carefully evaluate these products and decide whether to allocate resources to them or phase them out.
 Dogs
Dogs
Dogs are products with a low market share and low growth rate. These products do not generate significant revenue for the company and should be phased out unless they complement other products.
What are the benefits of using the BCG Matrix?
The BCG Matrix provides several benefits to businesses, including:
Portfolio evaluation: The BCG Matrix helps businesses evaluate their product portfolio and determine which products are generating revenue and which ones require investment.
Resource allocation: The BCG Matrix helps businesses allocate resources to their products based on their market share and growth rate. It allows businesses to invest in high-growth products and use cash cows to fund other products.
Simplified analysis: The BCG Matrix simplifies the analysis of a company’s product portfolio by categorizing products into four quadrants. It provides a clear visual representation of the products and their performance.
Strategic planning: The BCG Matrix helps businesses develop strategic plans for their products by identifying growth opportunities and potential risks.
Competitive analysis: The BCG Matrix allows businesses to compare their product portfolio to their competitors’ portfolios. It helps businesses identify areas where they have a competitive advantage and areas where they need to improve.
Focus on profitability: The BCG Matrix encourages businesses to focus on profitability rather than just market share. It helps businesses identify which products generate the most revenue and which ones are not profitable.
What are the limitations of using the BCG Matrix?
While the BCG Matrix is a useful tool for businesses, it is not without its downsides. Here are some potential drawbacks of using the BCG Matrix:
Simplistic approach: The BCG Matrix categorizes products into four categories based on market share and growth rate only.
Limited scope: The BCG Matrix is most useful for businesses with a diverse portfolio of products. It may not be as effective for businesses with a single product or a small number of products.
Inaccurate data: The accuracy of the BCG Matrix depends on the accuracy of the data used to plot the products. If the data is inaccurate or outdated, the analysis may be flawed.
Lack of guidance: The BCG Matrix does not provide clear guidance on how to manage products in each category. It is up to the business to determine the appropriate actions to take.
Overemphasis on market share: The BCG Matrix places a strong emphasis on market share, which may not always be the best indicator of a product’s success.
How do I use the BCG Matrix for my business?
As mentioned, the BCG Matrix helps businesses make informed decisions about their product lines and resource allocation. Here are some steps to use the BCG Matrix for your business:
- Identify your products: List all your products and their market share and growth rate.
- Plot your products on the matrix: Use the market share and growth rate to plot your products on the BCG Matrix.
- Analyze each product category: Evaluate the products in each category and determine what actions to take. Allocate resources to stars, use cash cows to invest in stars and question marks, evaluate question marks carefully, and phase out dogs.
- Monitor your products: Continuously evaluate your product lines and adjust your resource allocation accordingly.
What are the alternatives to the BCG Matrix?
While the BCG Matrix is a widely used strategy tool, it is not the only option available. Here are some alternatives to the BCG Matrix:
GE/McKinsey Matrix: The GE/McKinsey Matrix is similar to the BCG Matrix but includes additional factors such as industry attractiveness and competitive strength. It provides a more comprehensive view of a company’s product portfolio.
Ansoff Matrix: The Ansoff Matrix evaluates a company’s growth opportunities based on four strategies: market penetration, market development, product development, and diversification. It helps companies identify growth opportunities beyond their existing products and markets.
SWOT Analysis: SWOT (Strengths, Weaknesses, Opportunities, Threats) Analysis evaluates a company’s internal strengths and weaknesses and external opportunities and threats. It helps companies identify areas where they have a competitive advantage and where they need to improve.
Product Life Cycle Analysis: Product Life Cycle Analysis evaluates a product’s sales over time and identifies which stage of the product life cycle it is in: introduction, growth, maturity, or decline. It helps companies determine how to allocate resources to a product at each stage of its life cycle.
Blue Ocean Strategy: Blue Ocean Strategy focuses on creating new market spaces and uncontested markets rather than competing in existing markets. It encourages companies to create innovative products and services that open up new market opportunities.
In Summary
The BCG Matrix is a strategic tool developed by Bruce D. Henderson in 1968 to help businesses evaluate and prioritize their product lines. It categorizes a company’s products into four categories based on their market share and growth rate: stars, cash cows, question marks, and dogs. The matrix provides businesses with a framework to evaluate their product portfolio, allocate resources, and develop strategic plans. By using the BCG Matrix, businesses can make informed decisions about their products and focus on profitability rather than just market share. While the BCG Matrix has undergone some modifications over the years, it remains a widely used strategy tool in the business world.


