
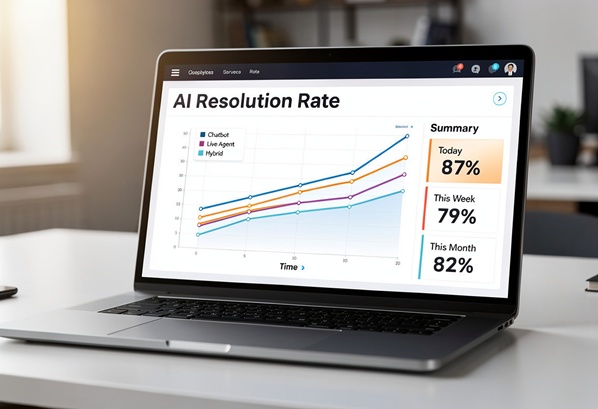
The same week of AI conversations can be reported as a 45% resolution rate or a 93% one, so here is the five-point check a service manager can run on any vendor’s number, applied openly to one published dataset.
An AI agent’s resolution rate is the first number on the slide and the last one anyone questions. It should be the other way round. The rate is one count divided by another, and both counts are choices the vendor made. Change the choices and the same conversations produce a different number.
My employer sells one of these agents, so I see those choices made from the inside. Here is the check I would run on any dashboard or sales deck, including ours.
One week, four rates
Take an invented week with round numbers. Your agent handled 1,000 conversations. In 450 of them the agent gave an answer and the conversation reached a clear close: the customer confirmed, or marked it solved. In 70 the agent passed the customer to a person. The other 480 ended in silence. The customer read something and left, and nobody knows whether it helped.
Now count.
- Resolved means a clear close, over every conversation. 450 out of 1,000. Resolution rate: 45%.
- Silence counts as resolved. 450 plus 480, over 1,000. Rate: 93%.
- Silence counts, but a resolution is reversed if the customer returns within seven days. Say 110 of the 930 came back. 820 over 1,000. Rate: 82%.
- Resolved means a clear close, but the denominator is only what the agent “attempted”. Say 150 of the silent conversations were on topics the agent had been told not to answer, and the 70 handoffs are set aside as not the agent’s job. 450 over 780. Rate: 58%.
Same week. Same agent. Same customers. Four rates from 45% to 93%, and every one of them can be defended in a meeting. The number tells you almost nothing until you know which count produced it.
Five things to pin down first
Run this list against any figure you are shown. If the answer to a question is not written down anywhere, treat the rate as unverified.
1. The denominator. How many conversations, as a raw count, sit under the line? A percentage on its own cannot be checked. Ask for the number of conversations and the number resolved, and divide them yourself.
2. What “resolved” means. Is it a close the customer confirmed, a close the agent declared, or a judgement made by a model after the fact? Each is a different claim about the customer. Get the sentence that defines it, in writing.
3. The rule for silence. In most AI conversations the customer never says whether the answer worked. They read it and leave. Ask whether a customer who stops replying is counted as resolved. If so, ask what the rate is without them, and compare that figure, not the headline, with what your team resolves today.
4. Where handoffs go. A conversation passed to a person can be counted as a failure, ignored, or taken out of the denominator so it never counts against the agent. Get handoffs as a separate, defined figure, and find out whether the rate treats them as failures or leaves them out.
5. The window, and whether it is pinned. Over what dates? Is the snapshot dated, so that what you were shown before signing can be checked a year later? A rate that updates live with no history is a rate that can be quietly re-based.
Reading one published number against the list
Here is how the list works on a real page, using the dataset I know best because my employer publishes it. The figures are from the Outlearn AI Support Benchmark, last updated 14 August 2026.
Denominator: 29,003 conversations, October 2025 to August 2026, with the raw counts printed beside the rates.
Definition: “resolved automatically” means the agent closed the conversation with no human involved, and the conversation reached an explicit close. By that count, 45.9% were resolved: 13,299 of 29,003.
Silence: conversations that ended without a resolution or a handoff are not counted as resolved. They are the remainder, which works out to 14,042 conversations, or 48.4% of the total. Fold them into “resolved” and the same corpus reads 94.3%. The page chooses the lower number and prints the other two lines so a reader can do that sum.
Handoffs: reported separately. 5.7% over the full period, 1,662 conversations, and 2.4% over the snapshot’s last 90 days, 259 of 10,694.
Window: dated, and a recent rate is shown alongside the all-time one. From 1 June to 14 August 2026, 50.8% of 10,694 conversations were resolved with no human. The page also flags that March 2026 alone accounts for 31% of the corpus, which is the kind of lump that moves an average.
That is what a full answer to the five questions looks like: every figure has a count, a definition and a date. Now the honest part, which is what it does not tell you. It does not say how many “resolved” conversations came back a week later, because the page publishes no reopen measure. It does not report customer satisfaction on the conversations the agent closed. It covers one vendor’s workspaces, not the industry, and says so. And a strict close is a fact about the conversation, not proof the customer left happy. A published number with a denominator is a number you can question. It is still not the whole story.
The two numbers to add in your first 90 days
The vendor’s rate tells you how the vendor counts. Two numbers of your own tell you whether the agent is working.
Bounce-back within seven days. Of the conversations the agent closed, how many customers came back on any channel with the same problem inside a week? Count it by customer, not by ticket, or a repeat email looks like new demand. This is the number that catches a generous silence rule. If the resolution rate is high and the bounce-back is climbing, the rate is counting exits, not answers.
Satisfaction on AI-closed conversations, kept separate. Send the same one-question survey you send after a person closes a ticket, and keep the two results apart. A blended score hides the gap. If AI-closed conversations score well below human-closed ones, you have found where the agent should be handing off and is not.
When you set a target, do not write the vendor’s rate into it. Measure your own strict rate in month one, with silence excluded, and treat that as the baseline. Set the month-three target as a rise from that baseline, with two conditions attached: bounce-back no higher than your human team’s, and AI-closed satisfaction within reach of human-closed. A resolution rate that rises while those two hold is a real gain. One that rises while they slip is a counting change.
Get the count, get the definition in writing, and keep your own two numbers next to the vendor’s one. The rate will come down. What is left is the number you can build a staffing plan on.
About the Author
Marija Jovanović is Head of Content at Helpjuice, the knowledge base company, which also builds Outlearn, an AI agent for customer service. She writes about how support teams measure, buy and run AI. The figures in this article come from Outlearn’s published AI support benchmark.